

TL;DR — the verdict: AI crop yield prediction is real and genuinely useful — but mostly at the district and state level, not for your individual plot. India already runs an official satellite-based forecasting system (FASAL) that estimates production for 11 major crops across 557 districts, and it works because it only has to be right on average over a big area. The headline “90–95% accurate” numbers you see are almost always measured at that aggregate scale, or on large uniform farms abroad. On a 0.16-hectare Indian plot — smaller than the satellite can cleanly see, with little local ground-truth to learn from — those numbers don’t transfer. Use AI yield forecasts to read the season and the region; don’t treat a model’s number as the verdict on what your field will actually give.
What “AI crop yield prediction” actually does
The idea is straightforward: feed a model satellite imagery (how green and healthy the crop looks over time), weather data (rain, temperature, soil moisture) and historical yield records, and it learns the relationship between those signals and the final harvest. Then, weeks before harvest, it predicts how much a field, district or state will produce.
This is the same family of technology behind the other tools we’ve covered — like the advisory in Bharat VISTAAR and the crop-disease apps — and it carries the same lesson: the demo number and the field reality are two different things.
The headline accuracy — and the catch
Reviews of these models report accuracies of roughly 85–95%, with deep-learning approaches (CNNs, LSTMs) often hitting an R² around 0.90 when they combine multi-season satellite and climate data. Compared with older statistical methods, that’s a real improvement.
The catch is in three words the marketing leaves out: at what scale? A model that predicts a district’s total wheat output to within 5% is genuinely impressive — but that accuracy is an average across thousands of fields, where individual over- and under-estimates cancel out. The same model pointed at one small plot can be far less reliable, because the errors no longer average away. Aggregate accuracy and plot-level accuracy are not the same number.
Whose data does it learn from?
A model is only as good as the labelled examples it trained on — and good yield labels are exactly what India’s smallholder belt is short of. To get a model working, researchers lean on a few workarounds, each with a cost:
- Transfer learning from data-rich regions. Many models are first trained where ground-truth is abundant — large, mechanised farms in the US, Argentina or Brazil — then fine-tuned for a new region. Useful, but the model’s instincts were formed on fields nothing like a fragmented Indian smallholding.
- Disaggregating national statistics. Where plot data is missing, some methods take official state or national yield averages and mathematically spread them across pixels. That can train a model, but you can’t recover plot-level truth from a number that was an average to begin with.
- Physical crop-cutting experiments (CCE). India’s real ground-truth comes from manually harvesting sample plots. It’s accurate but sparse — a few hundred sample points across a dozen states in a season — so it anchors district estimates, not individual farms.
Why small Indian plots break the assumptions
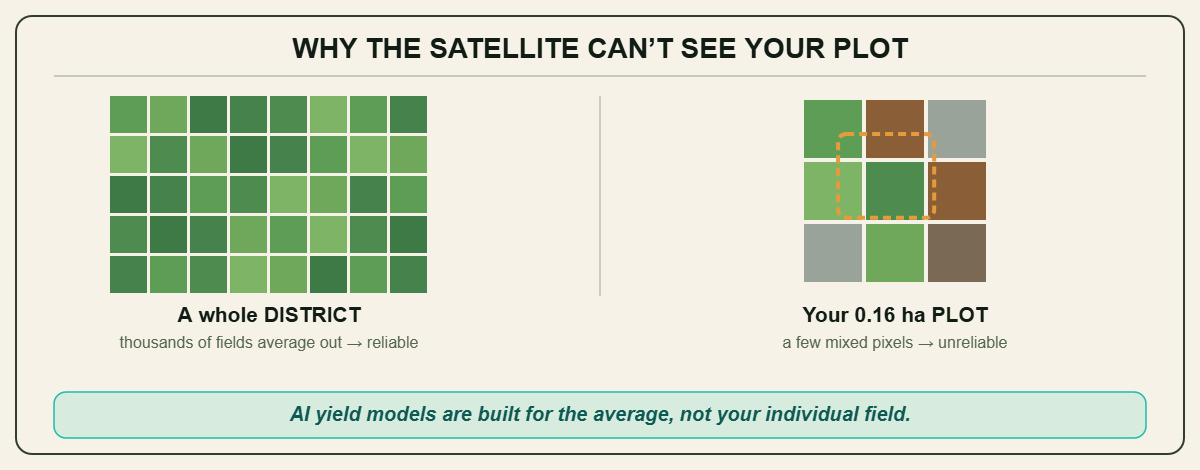
This is the heart of it. The freely available satellites these models rely on (such as Sentinel-2) see the ground in roughly 10-metre squares. That’s fine for a 5-hectare field. It is a real problem when the average plot is tiny:
- In Telangana, studies put the average field size at about 0.16 hectares, with 31 of 32 districts averaging under 0.7 ha — often just a handful of satellite pixels, with the edges blurred into neighbouring fields.
- Mapping and yield accuracy measurably declines on smaller fields — and Indian smallholdings frequently mix crops, intercrop, and vary within a single plot, which a coarse pixel simply cannot resolve.
So when a model “predicts your yield,” it may not even be cleanly seeing your field — it’s reading a smear of pixels that includes your neighbour’s crop, a path, and a tree line.
Where it genuinely works in India
None of this means the technology is hype. Used at the right scale, it’s already doing serious national work. India’s FASAL programme, run by the Mahalanobis National Crop Forecast Centre using ISRO procedures, produces satellite-based pre-harvest forecasts for 11 major crops across 20 states and 557 districts, combining optical and microwave imagery with weather models and CCE ground-truth. A newer system, YESTech, is pushing yield estimation down to the Gram Panchayat level for paddy, wheat and soybean.
That is exactly the right use: forecasting supply for policy, procurement, buffer stocks, price planning and crop-insurance settlement — decisions that depend on getting the regional number right, not your individual plot.
So what should a farmer take from a yield prediction?
Treat it as a weather-report-for-the-harvest, not a measuring tape for your field:
- Trust the direction, not the decimal. “This district’s paddy is tracking below last year” is useful and probably reliable. “Your plot will yield 4.2 tonnes/ha” is a guess dressed as a fact.
- Ask the scale question. If a service quotes an accuracy figure, ask whether it was measured at district level or plot level, and on what kind of farms. The honest providers will tell you.
- Use it for planning, not for betting. Regional forecasts can help you think about timing, storage and selling. They shouldn’t drive an irreversible choice on your specific field on their own.
The honest bottom line
AI crop yield prediction is one of the success stories of agri-tech in India — at the scale of districts and states, where it informs real decisions every season. The oversell happens when that aggregate accuracy is quietly repackaged as a promise about your individual smallholding, where the satellite can barely see the field and the model never had local ground-truth to learn from. Read it as a regional forecast and it’s a genuinely useful tool. Read it as the truth about your plot and you’re trusting a number that was never really about your plot at all.
Sources
- MNCFC — FASAL crop forecasting programme
- Dept. of Agriculture (DES) — FASAL overview
- Satellite-based crop monitoring strengthens India’s estimates (FASAL/YESTech)
- Field size vs satellite mapping accuracy, Telangana
- Field detection in smallholder systems — accuracy declines with field size
- Deep transfer learning for crop yield prediction (data-sparse regions)
- Review — ML/DL crop yield prediction methods and accuracy
